Performance is temperature.
StockFloc shows stock performance as temperature: any stock up 10% or more in a day catches fire on its row, and any stock down 10% or more freezes into ice. Everything calm stays quiet, so you feel the day at a glance instead of reading a number.
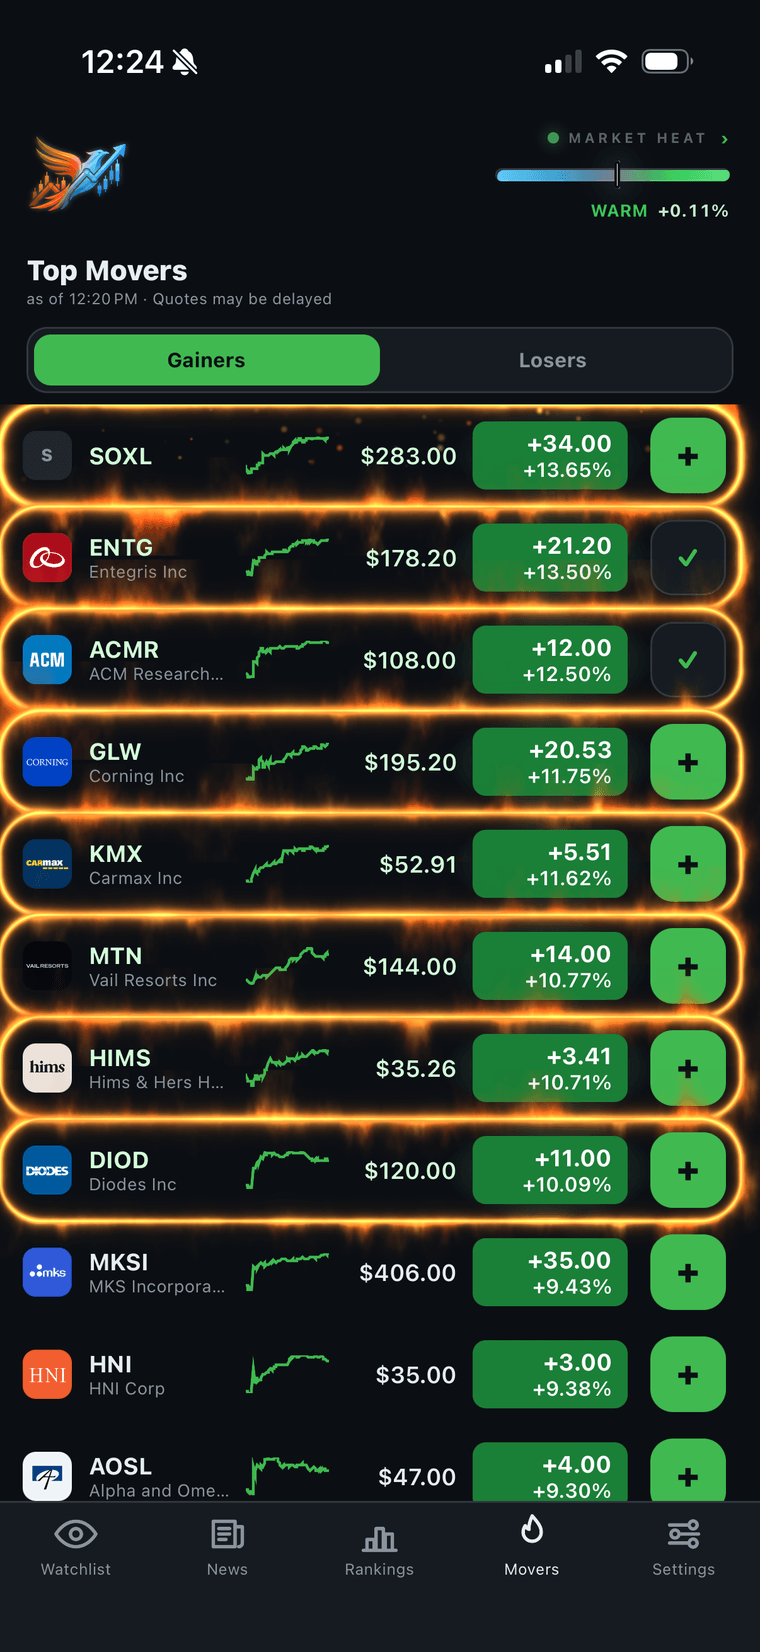
Cross 10% in a day, up or down, and the row erupts: winners catch fire, losers freeze over. Under 10%, it stays calm.
Fire means gains
A stock up 10% or more in a day ignites: a live flame on its row that you catch the instant you open the app. The most extreme movers get the full live effect.
Ice means losses
A stock down 10% or more freezes into ice, with frost creeping across the row. You feel a brutal day before you read a single red number.
You read the room, not the digits.
Static red and green watchlists make you scan numbers to find what moved. StockFloc puts the day's story right in front of you: the hottest names burn, the coldest freeze, and the calm ones stay out of the way.